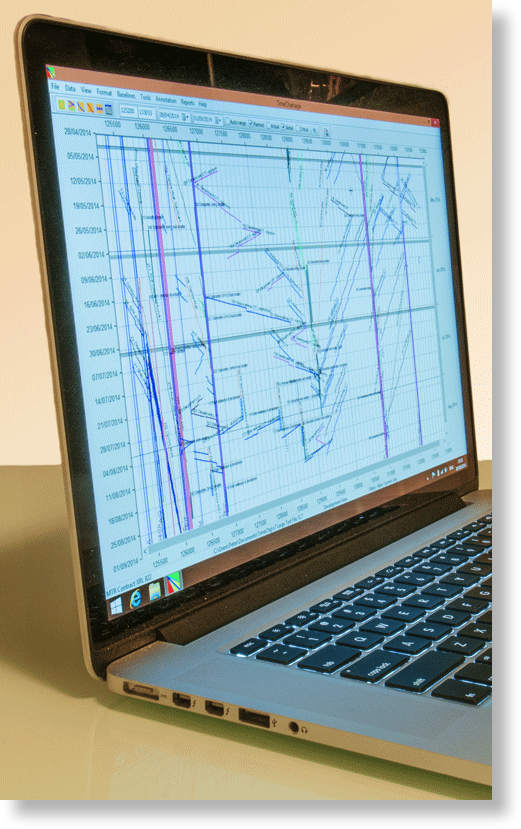
TimeChainage is a planning application for managing linear type construction projects such as tunnels, roads and railways. It is based on the time chainage format (also known as time location, or diagonal line) instead of the more conventional Gantt bar chart. By the addition of location information, the time chainage format adds an extra dimension to your schedule, giving you a great deal more information than an equivalent bar chart and in a more compact and readable form.

Examples of projects that can seriously benefit from linear scheduling with TimeChainage include Highways, Railways, Tunnels, Pipelines, Transmission Lines and Bridges.
TimeChainage is:
- Powerful, with all the planning, tracking and visualisation features you need
- Ideal for communicating a plan due to its easy to read, graphical nature
- Used with great success on projects ranging from small, local schemes to major infrastructure projects
- A must-have tool for planning and managing linear style projects
Planning
Plan your projects with full logic using the critical path method. Maintain visibility of planned production rates and time risk allowances. Can be used instead of Gantt charts or as a complimentary tool.
Progress Tracking and Reporting
Track progress and compare against your plan. See if you are improving against your plan or falling behind and why. Maintain a full as-built history. Use the built-in reports to analyse and report on progress. Create a variety of different reports quickly and easily using the export to Excel facility.
Presentation
The extra dimension given by the time chainage format along with comprehensive formatting tools allows for a clear and concise presentation of your schedule. Time chainage charts are often more popular than Gantt charts with both the Client and the Contractor's project managers.
What It Does
TimeChainage improves the visualisation of construction project schedules, providing an extra dimension to your programmes.
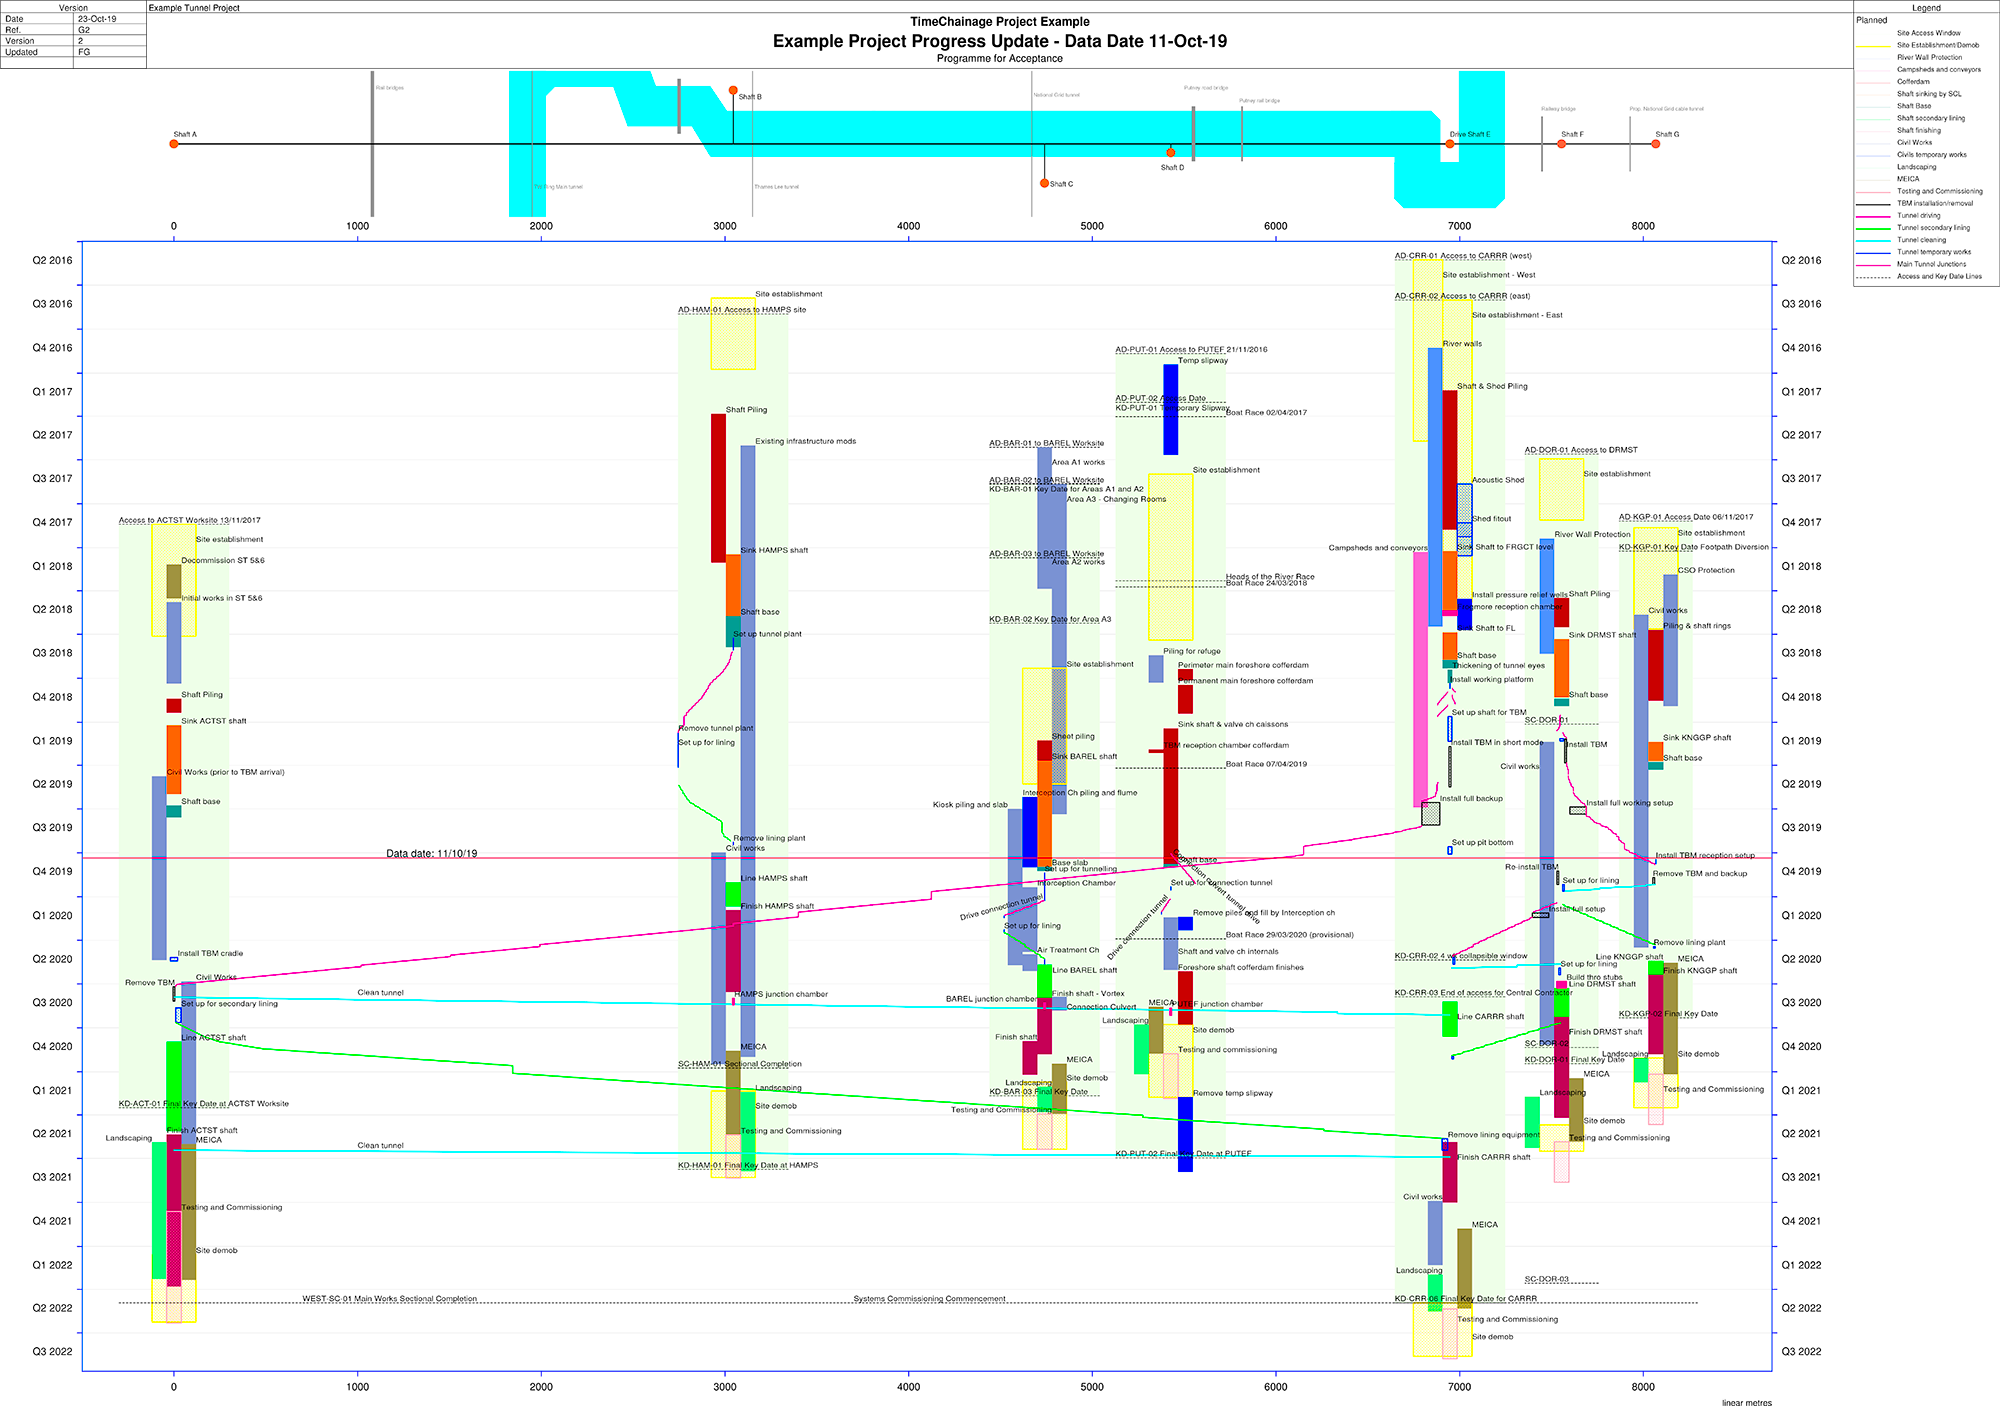
TimeChainage is a fully featured planning application using the critical path method to provide time based information similar to traditional Gantt chart applications. However, in addition, location information is input into TimeChainage providing the the extra dimension of distance. With time and distance comes production rate, so the slope of a line on a time chainage chart shows the production rate of the associated activity.
One great benefit of TimeChainage is its ability to display a whole project (or any section that you wish to show) on a single sheet, which helps to make the programme the focus of a review. Traditional bar chart schedules simply cannot provide this level of readability.
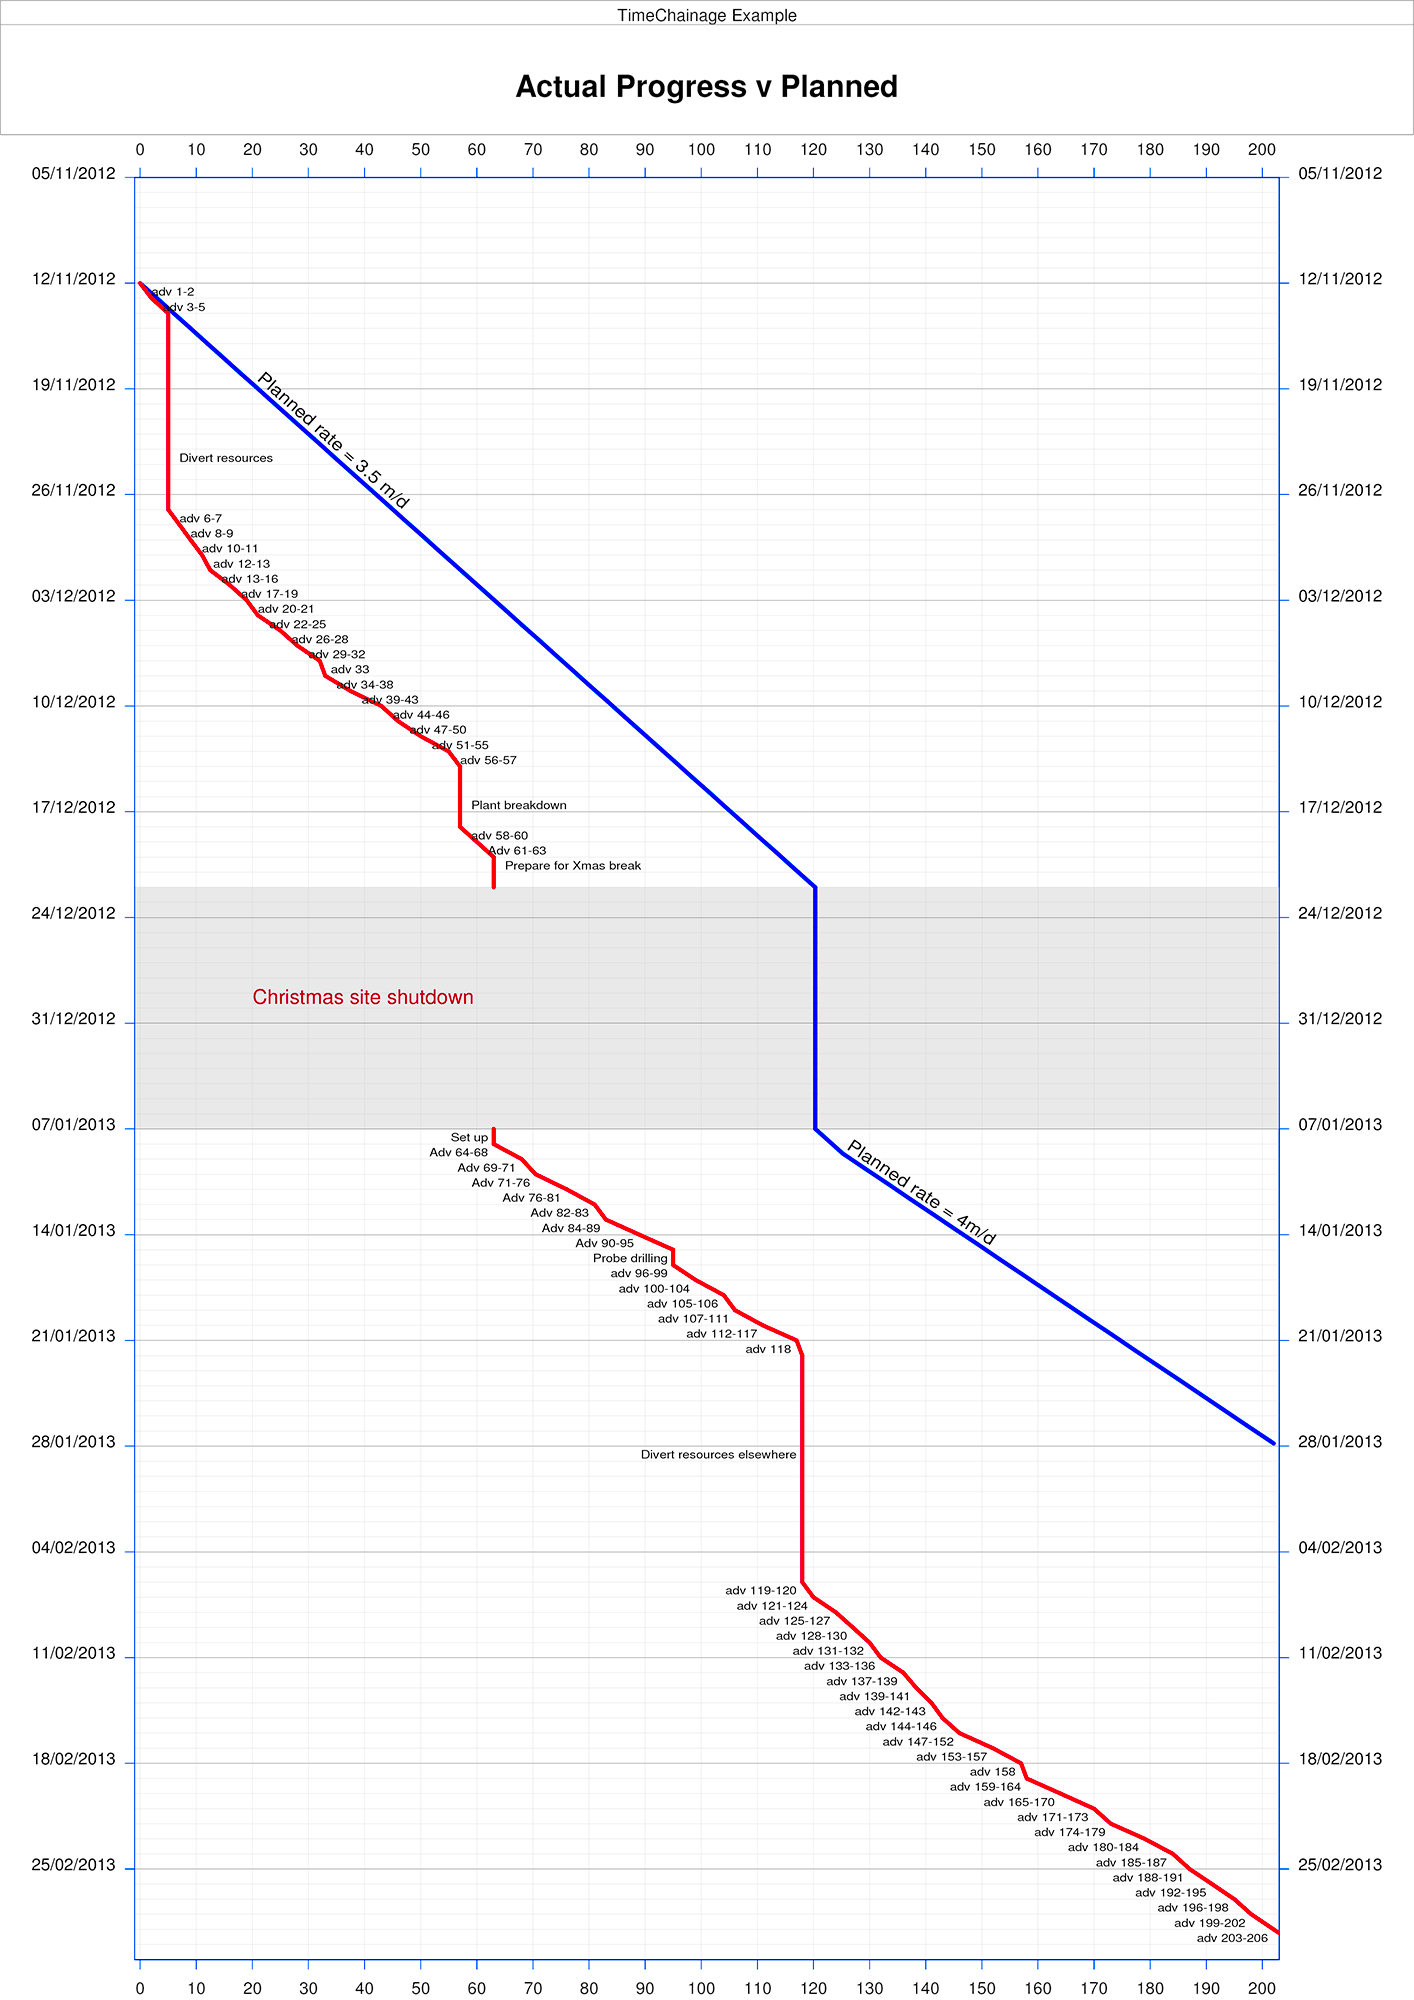
For progress tracking, actual progress is de-linked from the planned tasks to allow flexible input of data. What this means is that a very detailed as-built history can be developed (including down time) providing better and more comprehensive data for analysis and reporting.
Import data from Primavera P6 (or other planning software) to create a complimentary time chainage chart. Progress updates can be converted into time chainage format in just a few minutes providing an important reporting tool for virtually no effort.
Import data from Primavera P6 (or other planning software) to create a complimentary time chainage chart. Progress updates can be converted into time chainage format in just a few minutes providing an important reporting tool for virtually no effort.
Reasons for Choosing TimeChainage
- A time chainage chart is a great way to visualise a project programme. Because of its graphical nature it is easier to read than a Gantt chart and because of the distance information the chart shows more. TimeChainage then maximises these benefits by creating a good looking, clear chart with many formatting options. For these reasons, TimeChainage charts are invaluable in any review of the schedule.
- A superb tool for both preparing claims and claims analysis. It shows the impact of change, such as delays and changes in scope, very clearly, thus reducing the likelihood of dispute.
- A very quick return on investment is possible thanks to the combination of competitive price and functionality. As well as being capable of planning the works and generating different kinds of progress report, TimeChainage charts are ideal for reviewing the programme, deciding on options, explaining claims and much more.
- Shows potential clashes (e.g. two workfaces in the same place at the same time) allowing such errors to be avoided at the planning stage.
- For the Planner, TimeChainage provides flexibility in organising the schedule by the use of layouts, codes, formatting options etc. This improves efficiency and saves time in developing the schedule.
- Time chainage charts can be generated quickly from existing Primavera P6 schedules allowing TimeChainage to be used as an additional reporting tool alongside the traditional Gantt chart. Can also be used with other planning applications such as MS Project.
- The planning table within TimeChainage contains all the production rates assumed in the plan. The actuals table contains the full as-built history. This means a full record of both planned and actual data is maintained in a single project file. This data can also be exported to MS Excel if required for broader distribution.
- TimeChainage produces high quality output. Flexible formatting allows charts to be tailored to the individual project requirements. Progress analysis can be undertaken using the in-built reports and the data export facilities allow further analysis and reporting to be undertaken in MS Excel as required.